Use the Standard Assessment Window to see and edit a node's probability distribution as a table.
To access the Standard Assessment, select a node and then do one of the following:
Select the ![]() button on the task bar
button on the task bar
OR
Right-click the mouse button and then select Assess
OR
Select View from the top menu, then select Model Assessment
Accessing Standard Assessment brings up the Assessment Window containing the Assessment Table.
This window can be moved anywhere on the computer screen. To see the full table, resize the Assessment Window (for example, by dragging its lower right-hand corner).
At any time, MSBNx displays only one Assessment Window. That window, in turn, displays the probability distribution of only one node.
Typically, you will leave the Assessment Window up, but if you wish to close, you it can by clicking the close button.
![]()
The top of the window tells the model and node selected, in this case the model is "auto" and the node is "FanBelt". The table inside the window also has the name of the node at its top.
Below that is a column for each state of the node, in this case "ok" and "loose". These columns contain the probability that the node will be in each state. In this case, the probability that FanBelt is in the "ok" state is 0.97. The probability that it is in the "loose" state is 0.03.
The final column in the table is a bar chart. It shows the probability of each state graphically.
As you select different nodes on the Main Application Window, the Assessment Window tracks your selection. It always display the distribution of the selected node. To display the distribution of a new node, just select the node of interest in the Main Application Window.
If no node is selected, the table will be empty.
Let's look at editing probabilities, starting with the simplest case.
The FanBelt node has two states and no parents.

You can edit the probabilities that define its distribution by either typing in numbers or by sliding bars on the bar chart.
Suppose you want to change the probability that fan belt is loose to 0.05. Click on the value 0.03 and type "0.05". Alternatively, you can click twice on the value 0.03 and edit it. After typing the value 0.05, press Enter. The value 0.03 becomes 0.05 and the value 0.97 becomes 0.95.
If you press Esc rather than Enter, you change will not take effect.
If your change does take effect, it takes effect immediately, that is, there is no "Apply" or "OK" step needed. To undo a change, press Cntl-Z.
Alternatively, you can edit probabilities by to sliding the divider between bars on the bar chart. To start, move the mouse cursor on to the bar chart. Now, press-and-hold the mouse's left button. Your mouse cursor will jump to the division line. While holding the left mouse button, adjust the bar chart as desired, then let go of the left mouse button.
Your change takes effect immediately.
To undo changes, press Cntl-Z.
Consider this node with no parents and 3 states.
As before, we can edit its probabilities by typing in new numbers or by sliding the bars of the bar chart.
Now, however, typing in one number does not automatically change the other numbers. Rather all the numbers remain as given, even if they or their sum is greater than 1. For example, suppose we type "2" as the value of SampleNode under "State3".
To get the numbers back into the legal range from probabilities, we right click in the Window and select "Normalize Selection".
The result is that all the numbers are reduced proportionally such that they range from 0 to 1 and that their sum is 1.
When we slide the divider between two bars to the right, the bar immediately to the left grows and all the bars to the right shrink proportionally. When we slide a divider to the left, the bar immediately to the left shrinks and the all the bars to the right grow proportionally.
Probability distributions become more interesting when a node has parents. Consider, for example, this model of snow. Here the probability of snow depends on the cloudiness of the sky and the temperature.
Here is an assessment for Snow.
This says, for instance, when the sky contains some clouds and the temperature is freezing, the probability of snow is 0.33. Notice that the table contains one row for every combination of parent states.
You can edit any of these rows as before, by typing or my moving the bar chart. Also, as before, Cntl-Z will undo the last several edits.
You can also edit two or more rows as the same time by
Selecting multiple rows, and
Editing one of the rows.
To select multiple rows,
First select one row by left clicking on its bar chart or numbers.
Then select more rows by holding down the Cntl key and left clicking on their numbers or bar charts.
Here we see two rows selected.
You can select a range of rows by first selecting one row and then holding the Shift key and left clicking another row.
To unselect all rows, click a table heading, for example, the text that says "bar charts".
Suppose you want to select all rows in which Temperature is "Above Freezing". Just left click on the value "Above Freezing" in the Temperature column.
If you then hold the Cntl key and click on "Freezing", all the rows in which Temperature is "Freezing" will be added to the selection. This selects all rows.
Notice that the state "Clear" in the Sky column is selected as are the "Some Clouds" and "Overcast" states. The Assessment table selects the state of a parent automatically whenever all its rows are selected.
(As a reminder, to unselect all rows, click any table heading, for example, the text that says "bar charts".)
In contrast with a standard node, a node with Causal Independence (CI) does not need to list every combination of parent states. Instead, its distribution can be specified like this:
In this example, the node EngineStart has seven 2-state parents. A table with one row for every combination of parents would have 128 (27) rows. Because EngineStart is a CI node, its table has 8 rows.
The first row is the "C.I. Leak Term". It is here that you specify how likely things are to go wrong, even when all the known causes are OK. In this example, the probability that the engine won't start when all known causes are OK is 0.
Each of the remaining rows tells the consequences of having a parent node in a non-normal state. For example, the second rows says that if the only thing wrong is that ETO (Engine Turn Over) is "no", then the probability of that the engine will start is 0. The last rows says that if the only thing wrong is that the spark plugs are bad, then the chance of the engine starting is 0.3.
To help you distinguish between a parent's one and only normal state and its one or more abnormal states, names of normal states are in parenthesis.
As always, you can edit these probabilities via typing text or by moving the bar charts. As with normal nodes, you can select multiple rows by left clicking on the probabilities, the bar charts, or the parent states. To add to the current select, hold the Cntl key while clicking. To add a range, hold the Shift key. To unselect all rows, click any table heading, for example, the text that says "bar charts"
When you select rows in the Assessment Table and then right-click on them, you'll see a pop-up menu like this:
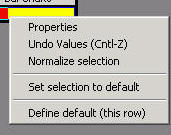
Let's look at each menu item in turn.
Properties - Brings up Property Pages that allow you to control how the Assessment Table looks. See the next section, "Properties", for details.
Undo Values (Cntl-Z) - Undoes the most recent changes in the probabilities. It can restore about 100 value changes.
Normalize selection - Makes proportional changes to the the numbers in selected rows so that each row sums to one.
Set selection to default - Changes the probabilities in the selected rows to the default probabilities. For a CI node, the uniform distribution is the default. For standard node the default starts as the uniform distribution, but you can change it.
Define default (this row) - For standard nodes use this to define the default probabilities.
If you have no rows selected and right-click, you'll see a pop-up menu like this:
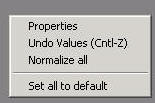
The new menu items here are
Normalize all - Makes proportional changes to the the numbers in every rows so that every row sums to one.
Set all to default - Changes the probabilities in every row to the default probabilities
You can use the Property Pages of the Assessment Table to change its appearance. Let's look at each Property Page in turn, starting with the "General" page.
The four sections of the General Property Page are "Whole Control", "Value", "Heading", and "Bar Chart".
The whole control properties are
Columns, which can be set to
"Fit Manually" - Allows you to resize the width of columns with your mouse to whatever size you chose.
"Fit to the Text" - Makes columns just large enough to display the text inside them.
"Fit Evenly" - Makes the table fill the whole window and makes each column the same size.
Show - You can decide to show numbers and bar charts, just numbers, or just bar charts.
Text - You can have text centered, left justified, or right justified.
Here is an example of setting "Columns" to "Fit Evenly", "Show" to "Bar Charts Only", and "Text" to "Left Justify".
You can display values as either probabilities (the default) or as odds. Odds display mode can be useful when odds are easier than probabilities to assess.
Here is an example of the odds display mode:
When in odds display mode, values are keep normalized so that the smallest nonzero value is always 1. Odds mode does not affect the bar charts. The bar charts always show probability.
You can control the heading information in the Assessment Table. The choices are
Show Top Row - When selected, the top row of the table (the one that says "Parent Node(s)" and the name of the node) will be visible.
Use Node Descriptions - When selected, the description of nodes rather than their names are displayed.
Show Prob/Param Expression - When selected, the table is labeled with an expression.
Here is an example of selecting all three options.
You can control the colors of the bar charts and their resolution.
You can control the colors of the Assessment Table.
By controlling the font of the Assessment Table, you can control the size and look of the table.
For example:
To copy the values of a row to other rows:
Unselect everything by clicking on, for example, the text "bar charts" on the table heading.
Select the row to copy with left click.
Use Cntl left-click to select other rows
Left click on the bar chart of the row-to-copy. The other bars will change to match the row-to-copy.
Do all these actions on the Main Application Window. The Assessment table automatically tracks your changes.