The model diagram window is the primary document of MSBNX. Each window represents a Bayesian belief network. Each window can only view a single belief network, but multiple windows can view the same belief network.
You can control the diagram window by:
Direct manipulation of the objects within it, using standard operations such as dragging and selection.
Choosing enabled buttons from the right-hand toolbar.
Choosing menu items from context menus available on the diagram.
The toolbar and status bar support "tool tips". When you hover your cursor over a toolbar button or a section of the status bar, a small message will appear explaining its function.
When maximized, a typical diagram window might appear as:
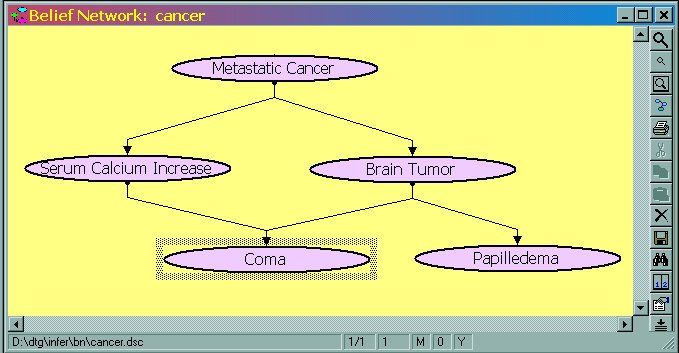
Note the window-specific toolbar at the right and the status bar at the bottom.
The toolbar supports saving, printing and zooming. See Model Diagram Window Toolbar for more information.
The status bar tells about the state of the underlying model. From left to right, its sections or segments indicate:
The complete path and file name of the model file.
The number of current windows viewing this model and the relative index of this window.
The number of nodes selected in the diagram.
An "M" indicates that the diagram has been modified since it was last saved.
The number of undo levels stored.
A "Y" indicates that the model is ready to perform probabilistic inference.
Again, you mainly use "tooltips" to see these descriptions.
As with most modern graphical applications, you can simply left-click you mouse on an object. The standard operations are these.
|
Operation |
How-to |
Meaning |
|
Selection |
Left-click on a node or text notation segment. |
Make the selected object the target of the next operation. All previously selected objects are unselected. |
|
Multi-selection |
Hold down the control (CTRL) key while left-clicking one or more objects. |
Extends the selection to the objects clicked on. |
|
Drag |
Left-click on a selected object and move to the desired position. |
Allows new arrangement of the displayed diagram. |
Much of the functionality of MSBNX and its components is presented through context menus. To see a context menu for the diagram, right-click the mouse over any unoccupied space in the diagram. To see a context menu for a node (variable) or arc (edge), right-click on it.
See Context Menus for more information.
Inference can be performed directly from a diagram window.
To enter evidence for a variable, use its node's context menu to set its state.
To view the posterior probabilities, enable bar chart displays for any or all of the nodes in the model.